PopGis v3
A new version of PopGIS is coming soon!
PopGIS2 has been a very popular application for users to access and visualize sub-national datasets through interactive maps and tables. In the last 12 months, PopGIS2 has had 8,000 hits across the 14 sites.
The 13 country sites contain primarily census datasets, though some also include education and poverty indicators, cyclone evacuation centres, school, household and hospital locations and more. There is also a regional site to access NMDI indicators for the Pacific.
In total, users have access to 11,000 indicators and 12,000 calculated values (proportions, ratios). All datasets, GIS layers and maps can be easily downloaded.
You can view the existing PopGIS sites here.
What is new in PopGIS3?
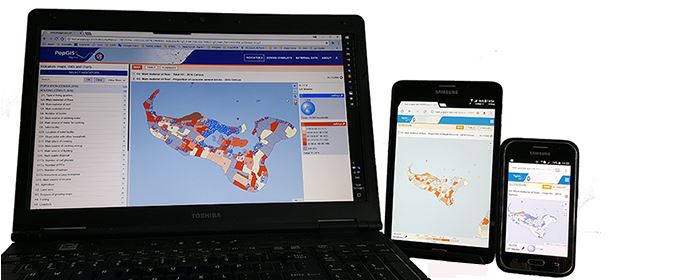
- A new interface based on HTML5; It is faster, more responsive and can be used on laptops, tablets and smartphones.
- Improved data import capabilities. It will be easier to import external data, aggregate to higher geographic levels and produce your own maps and reports.
- The TJS plugin for QGIS will be adapted to PopGIS3.
Recent updates
PopGIS3 for the Solomon Islands is now complete
PopGIS3 for the FSM is now complete and livePopGIS3 for the FSM is now complete and live
PopGIS3 for the FSM is now complete and livePopGIS3 for the Cook Islands is now complete
PopGIS3 for the Cook Islands is now complete and livePopGIS3 for the Marshall Islands is now complete
PopGIS3 for the Marshall Islands is now complete, and live.PopGIS3 for Kiribati is now complete
PopGIS3 for Kiribati is now complete, and live.PopGIS3 for Vanuatu is now complete
PopGIS3 for Palau is now complete, and live.