On Going
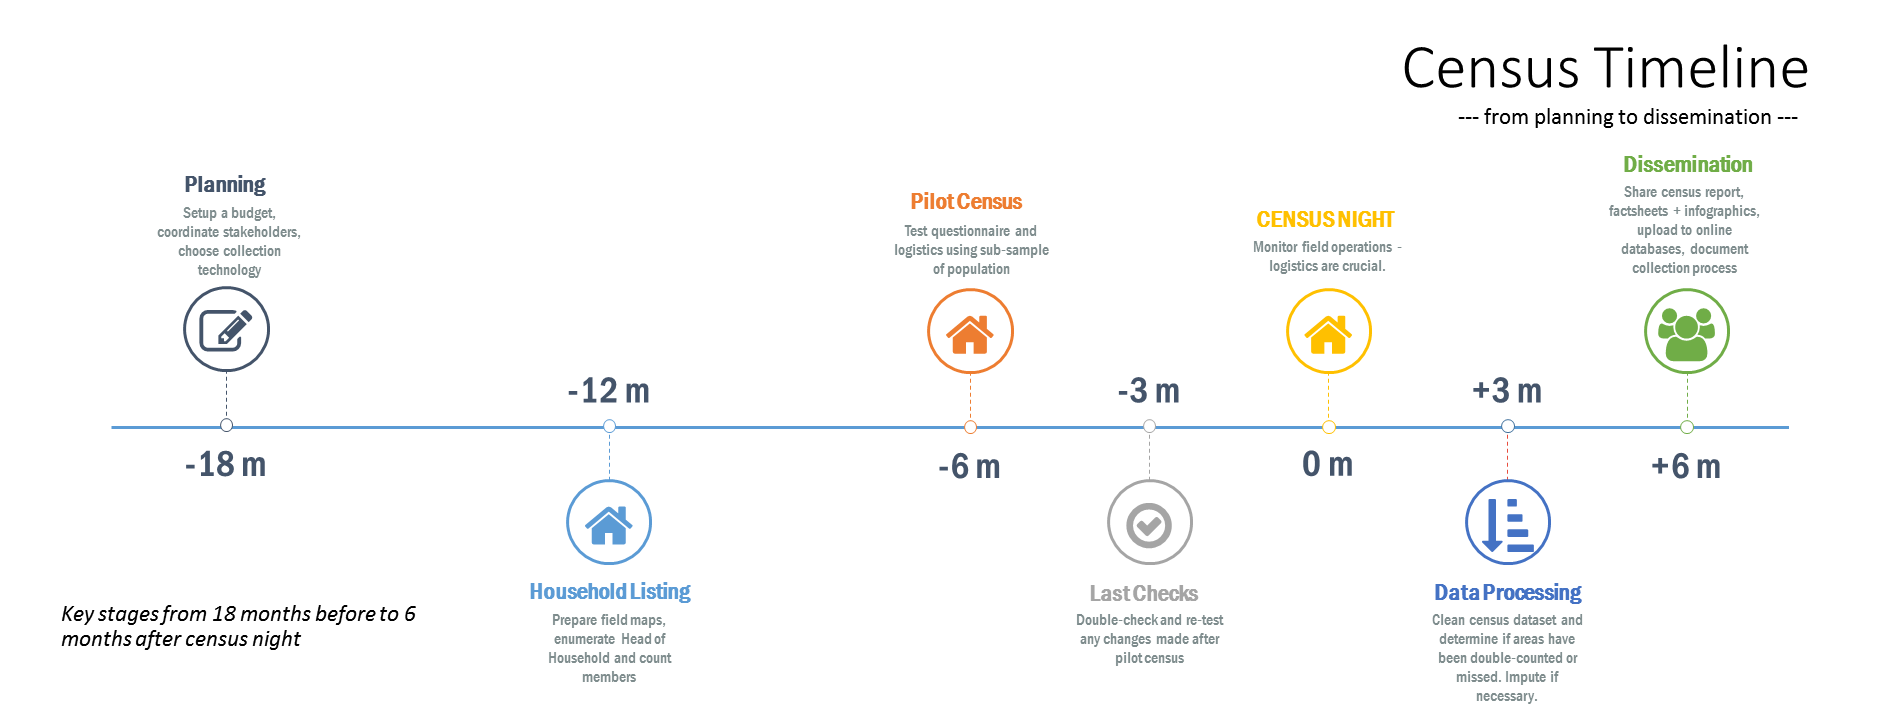
The Statistics for Development Division is setting up a knowledge base of documentation and presentations to assist countries embarking on censuses and surveys to plan and conduct the activity, and users of the resulting data to better understand how the data was collected. Starting with Population and Housing Censuses, each collection covered on the site will contain a timeline infographic listing the key stages to the collection. Each of these key stages will contain material such as:
- project plans and budget templates,
- training material to help conduct each of the activities where training of field staff is required (household listing, pilot census, main census)
- tutorials to help with anything from updating map boundaries in a mapping application to conducting a census with tablets.
Recent updates
Crops and livestock statistics updated with latest data from FAO
Crops and livestock statistics updated with latest data from FAO
A new version of PopGIS is coming soon!
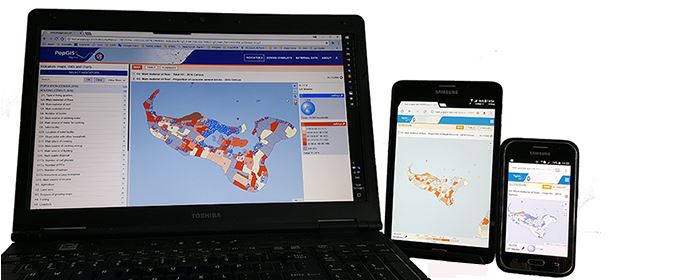
PopGIS2 has been a very popular application for users to access and visualize sub-national datasets through interactive maps and tables. In the last 12 months, PopGIS2 has had 8,000 hits across the 14 sites.
The 13 country sites contain primarily census datasets, though some also include education and poverty indicators, cyclone evacuation centres, school, household and hospital locations and more. There is also a regional site to access NMDI indicators for the Pacific.
In total, users have access to 11,000 indicators and 12,000 calculated values (proportions, ratios). All datasets, GIS layers and maps can be easily downloaded.
You can view the existing PopGIS sites here.
What is new in PopGIS3?
- A new interface based on HTML5; It is faster, more responsive and can be used on laptops, tablets and smartphones.
- Improved data import capabilities. It will be easier to import external data, aggregate to higher geographic levels and produce your own maps and reports.
- The TJS plugin for QGIS will be adapted to PopGIS3.
Recent updates
Crops and livestock statistics updated with latest data from FAO
Crops and livestock statistics updated with latest data from FAO
PDH.stat is a re-branded version of “.Stat Suite”, the SDMX-based statistical indicator platform built by the Organisation for Economic Co-operation and Development (OECD) through the Statistical Information System Collaboration Community. This platform replaces, and expands on the very popular, yet outdated National Minimum Development Indicator (NMDI) database which was established to report on Pacific development indicators including the Millennium Development Goals (MDGs).

PDH.stat is hosted under the Pacific Data Hub (PDH). The Pacific Data Hub architecture is designed to accommodate data or links to data from relevant governments, Non-governmental organisations, Intergovernmental organisations, academic institutes, think-tanks and other organisations with data and interests in the Pacific. New regional initiatives established by partners have the option of publishing their data through the PDH instead of standing up their own bespoke portals, hubs or websites. The data can be made accessible through either open data licensing agreements, or where appropriate confidential or restricted data agreements.
What is SDMX?
SDMX, which stands for Statistical Data and Metadata eXchange is an international initiative that aims at standardising and modernising (“industrialising”) the mechanisms and processes for the exchange of statistical data and metadata among international organisations and their member countries.
Features of PDH.stat architecture:
- stores stuctured SDMX datasets,
- thorough metadata on datasets and individual indicators,
- powerful API allows machine-to-machine access to all datasets in the database enabling development partners, researchers and other, users to programatically extract information.
Features of PDH.stat explorer/browser interface:
- find datasets with free-text search, fine-tune search results through context-specific filters (facets) for topics and relevant data dimensions, and download an entire dataset,
- preview and download multi-dimensional tables and charts, and
- share created tables and charts in blogs and social media, or embed them dynamically in web pages.

Recent updates
Crops and livestock statistics updated with latest data from FAO
Crops and livestock statistics updated with latest data from FAO
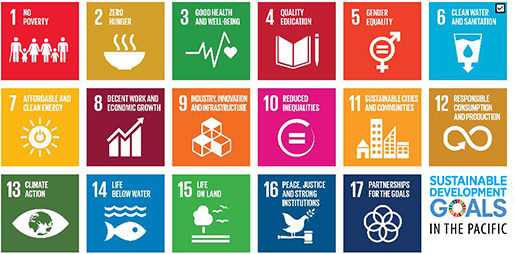
The Statistics for Development Division is currently working on a Sustainable Development Goal (SDG) Dashboard to provide easy access to Pacific SDG indicators. The Dashboard is being built within the Pacific Data Hub (see more below) and will allow users to explore, visualise and download SDG-specific datasets.
This new SDG Dashboard will dynamically pull data out of the PDH.stat indicator platform being implemented to replace the very popular, yet outdated National Minimum Development Indicator (NMDI) database which was established to report on Pacific development indicators including the Millennium Development Goals (MDGs).
We hope to provide regular updates of progress on this page. All comments are welcome.
Pacific Data Hub
The Pacific Data Hub is an ambitious initiative aiming to connect people with knowledge and information on the Pacific, regardless of where those assets are stored. The data hub will either host data sets and knowledge products or just host information about data sets and knowledge products that are stored elsewhere. In addition the Hub will:
- Establish good data management and governance practices
- Improve discoverability, accessibility, utility, useability of data (including good metadata)
- Provide data stories and insights, maps, dashboards, visualisations
- Federate Pacific data from within SPC and development partners
- Provide advanced search functionality
- Allow data curators to publish stories, insights and guidance which provide context for data consumers , especially member countries who may not have the capacity to do the analysis
- Provide programmatic access to allow greater sharing of data with development partners, researchers, private sector etc
Recent updates
Crops and livestock statistics updated with latest data from FAO
Crops and livestock statistics updated with latest data from FAO